Twitch Case Studies
At a glance
My role
UX Design and Research Lead
Impact
V1:
~12% adoption
~13% more page visits
V2:
Vastly improved user consumption:
Between 3.5x and 6x increased CTR
~3% increased minutes watched
Learnings
Creators can better grow their channel and community through relevant and usable data
Contextual data will achieve this at an incredibly higher rate than simply providing metrics - not everyone is a data scientist.
User Need
Prior to this tool’s release, Twitch provided its creators the ‘what’ - various performance metrics across their content - but not the ‘why’ - context and detail for why these metrics were important, and how to use them.
We needed to provide creators a way to directly connect moments in their stream to changes in metrics. Being able to pinpoint these moments helps educate creators what worked well during their stream, and identify opportunities of improvement, or things to avoid in the future. Audience engagement - especially for new and up-and-coming creators - can make or break a creator’s experience, and we wanted to build a tool focusing on improving the experience for both creators and viewers alike.
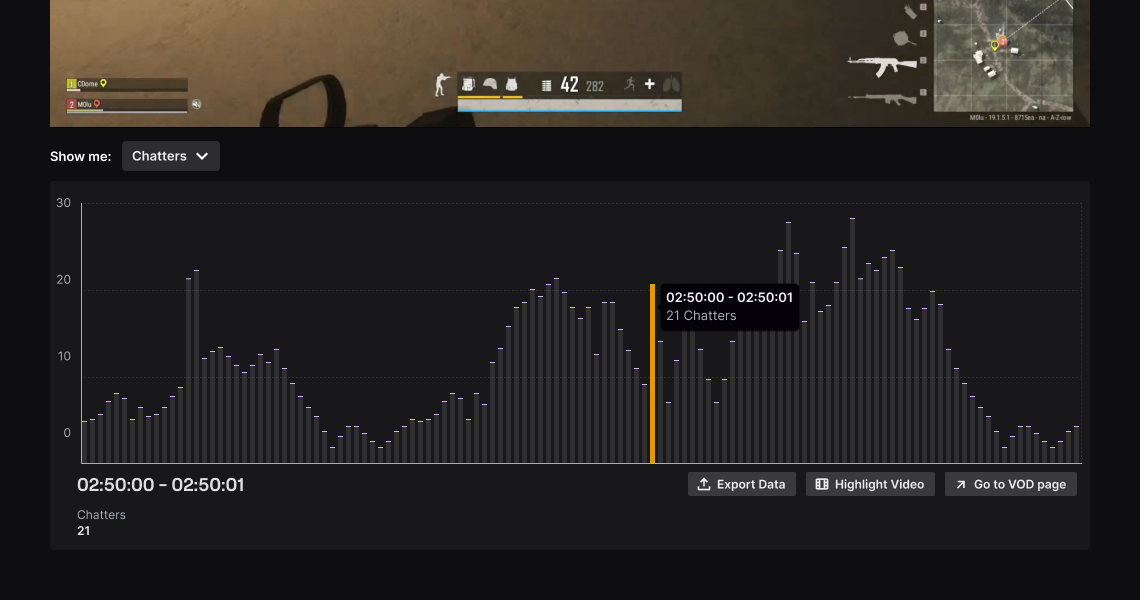
The V1 of this tool aimed to do this by connecting their VOD content to a graph of Chat Activity over every 5-minute segment of their stream.
VOD Tool V2 expanded on this by merging the tool with other existing analytics surfaces, and greatly improving the various backend data services serving the Creator Dashboard.
Research & Data
While 89% of new creators watched their own VODs, we were failing new creators in the following ways:
47% of new creators felt “the data Twitch provides helps me learn what content engages my community”
39% of new creators felt “the analytics Twitch provides help me identify memorable moments in chat”
User interviews pulled similar qualitative data, with users showing great dissatisfaction for the existing analytics experience.
Design Process
Low-fi Concepts
Our initial round of UXR consisted of presenting the below concept to users and asking for their feedback on it. Users were able to glean its function easily, and were generally excited about the prospect of having a tool that would directly link the number of chat messages to precise moments in stream.
Being an informational streamer, I like to know how things work and why things happen. A lot of times you wonder “why was chat quiet”, “is nobody really interested?”
Feasibility Studies & Requirements
Following our initial concept work, we conducted a series of feasibility studies with our engineering partners to learn what was possible and not within this space. These studies resulted in the following product requirements:
Our tech only allowed us to show data for each 5-minute segment, with further improvements to granularity following the V1 experiment
The graph would not be able to be overlaid on the video player
Pillboxes and other layered items - apart from a standard tooltip - were not possible
Surfacing chat was not possible due to technical and time constraints
I also synthesized design goals and laid out basic user stories for the front-end experience, including (but not limited to):
The user should be able to complete all existing VOD actions in this tool
A Highlighting feature and Clip Creator existed in a separate Video Editor product
The selected data (timestamp and number of messages) should show outside of tooltip at all times for better accessibility
The user should be able to control the video by clicking on segments of the graph, therefore quickly jumping to that 5-minute segment
Mid-Fidelity Explorations
Using the above inputs, I continued to explore the front-end experience in a series of mid-fidelity mockups.


V1 Release
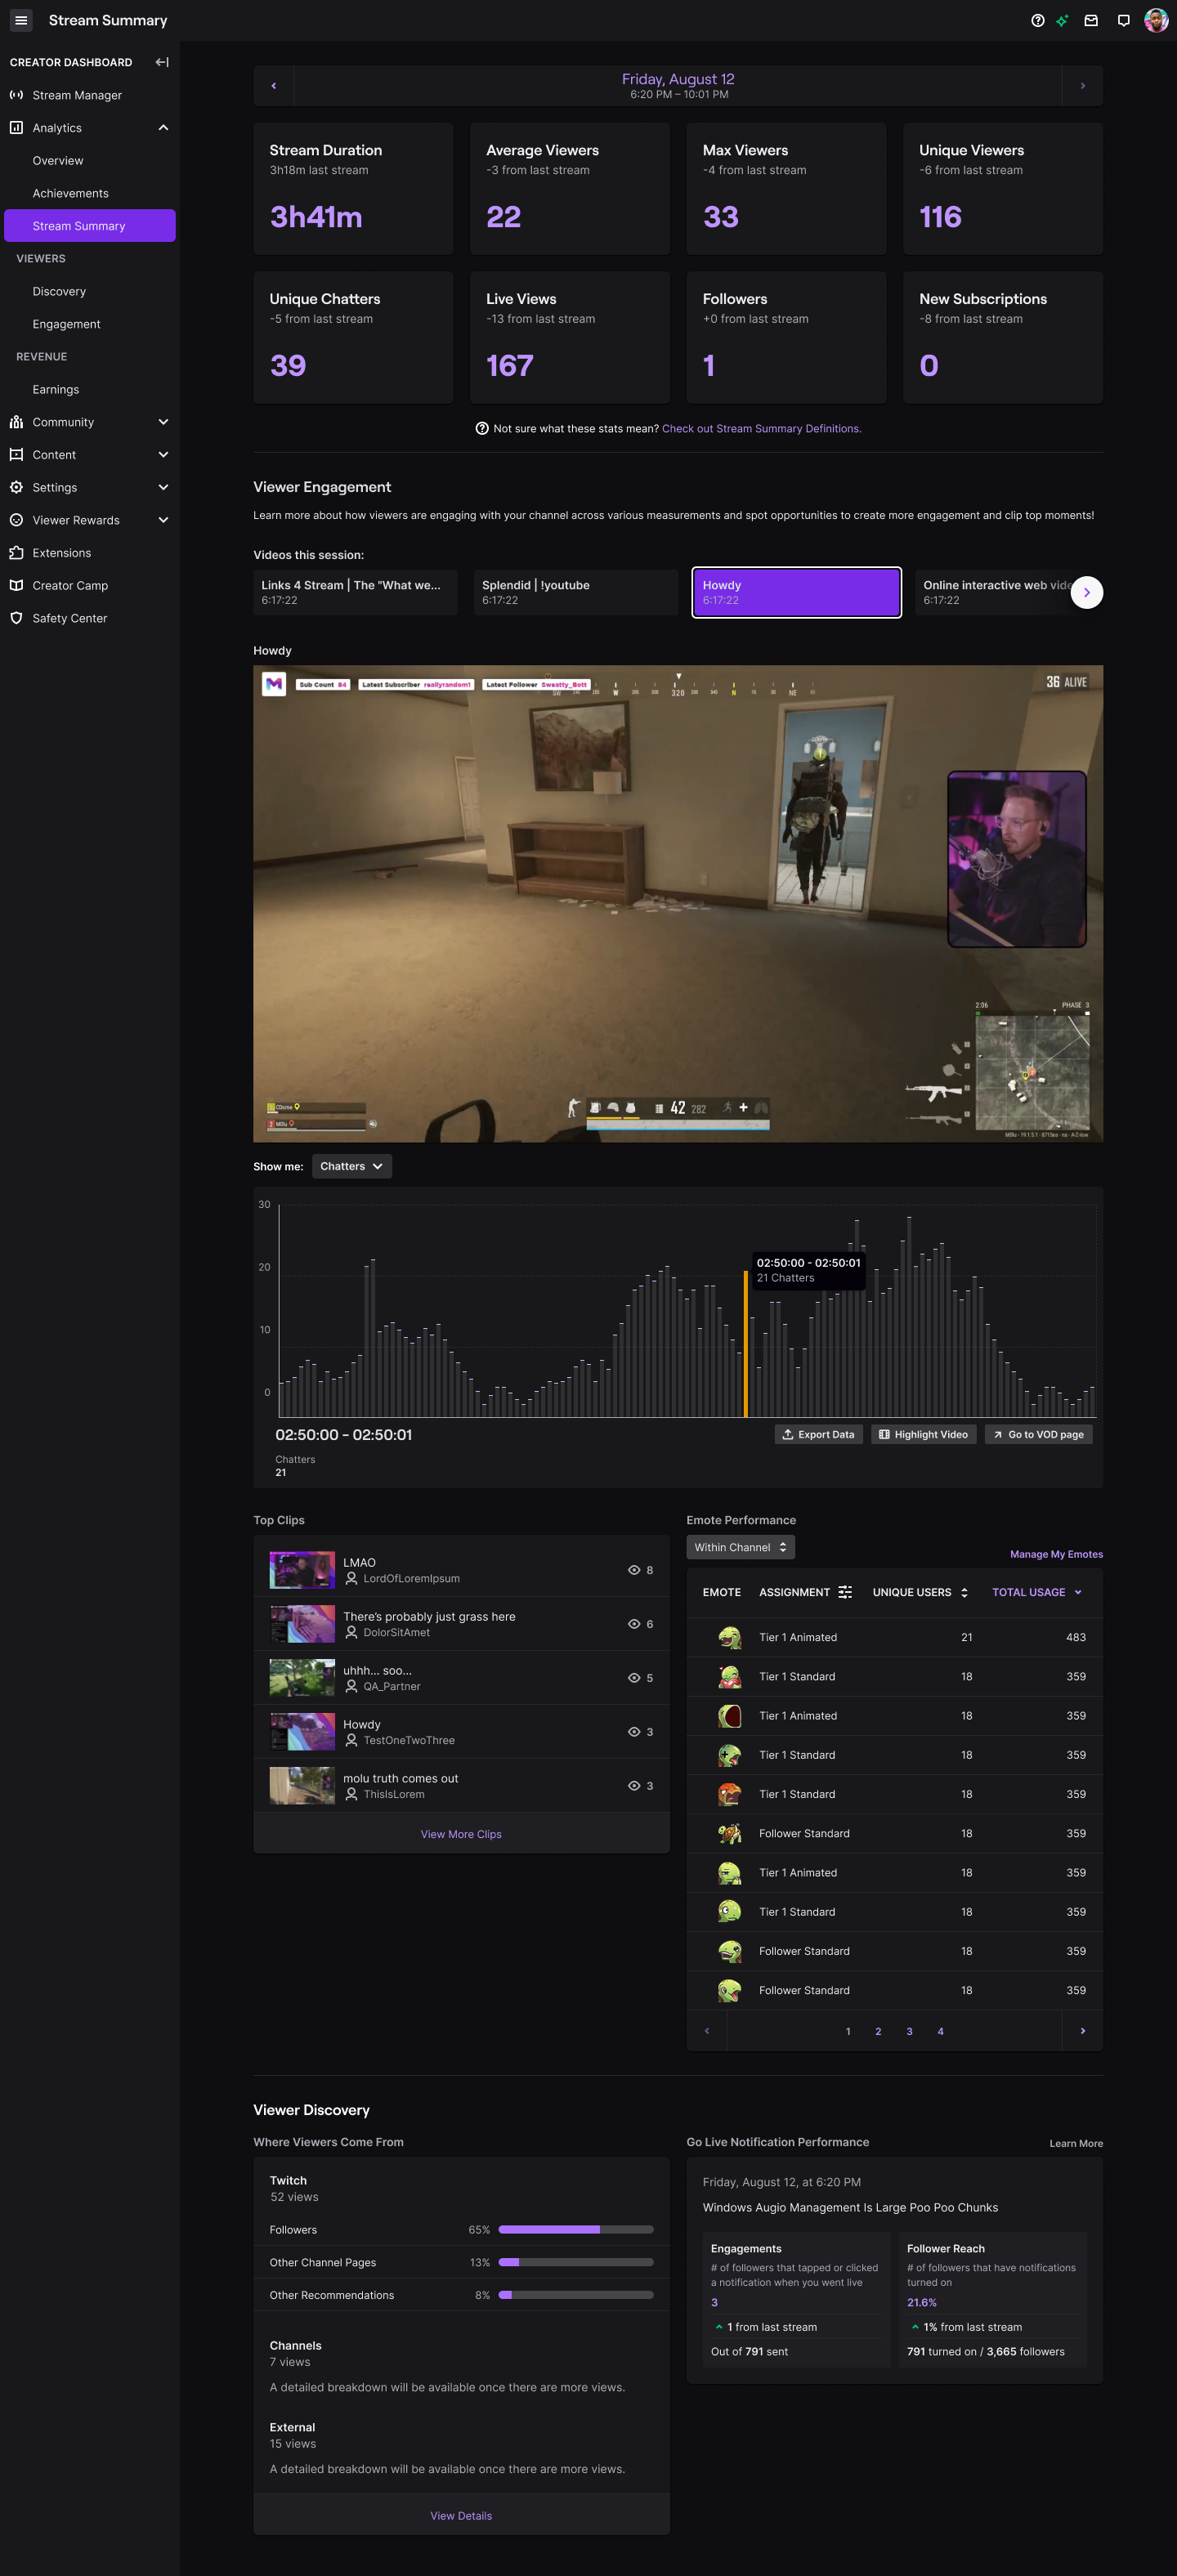
Below is the V1 release of the tool within the entire Creator Dashboard experience. This page, called Stream Summary, is the summary of a user’s past broadcasts. Key metrics appear at the top of the page, and the VOD tool is featured prominently in the first module position below the header metrics.
v1 Outcomes
The V1 experiment ran for 3 months, targeting a subset of new and up-and-coming creators that accounted for 7% of total creators. It saw the following results:
12.6% increased visits to the Stream Summary page containing the module
11.5% increased interaction with the module compared to other modules on the page
Due to its success, the tool was gradually rolled out to 100% of all creators.
Evolution into V2
While V1 was incredibly successful, it had some limitations that we wanted to focus on for improvement:
Allow users to navigate through their entire broadcast from that day (or session), not just the most recent segment of it
Streams were automatically broken into segments when a user changed categories (switching games, or from a game to ‘just chatting, etc), or if they experienced an internet disconnection, etc.
5-minute granularity still required the user to search through 5-minute segments for that perfect moment, which was time-consuming.
Finer granularity would vastly improve this experience, but required massive improvements to our backend data services.
The V1 only showcased Chat Activity, but the dashboard page contained so much other data in various, jumbled places.
This tool could be the ‘home’ for all of these analytics, many of which were completely disconnected from the actual stream or video. Bringing context to this data was vital to our product strategy as it would bring incredible usability, growth, and data literacy to creators.
The current design system had limited-at-best handling for data visualization, especially accessible solutions.
We needed both data viz components and control schema for those components that were accessible for a gamut of needs, including colorblindness, low vision, and motor control differences. The ability to navigate the graphs - which could sometimes consist of hundreds of bars - was the heart and soul of our product, and should be doable by any user.
…and so we did just that!
V2 Improvements
Stream Session Navigation
Our first project was to allow users to browse through all stream segments within that day’s session within the tool, so they can gain a more holistic picture of that session’s performance regardless of switching categories or unforeseen interruptions. We did this through a simple tab system that displays that session’s title and duration, and pagination arrows when users had a higher number of segments in that session.

Data Granularity Improvements
Next up, we needed data at a much more precise (and flexible) granularity. V1 limited users to 5-minute segments, but that still required creators to sift through those segments for that perfect clip or social media moment. V2 brought massive improvements to our backend data services, including flexible, dynamic granularity down to 1-minute segments! This required an equally dynamic front-end with various breakpoints within the data visualization:

Metric Expansion and Tech Consolidation
While my amazing team of engineers began consolidating a lot of disparate data services throughout the page, I audited the page for potential overlap - and found many instances of it. Other modules on the page served similar metrics, but none provided the same experience and context than that of VOD Tool - in fact, many of these tools saw their usage plummet with our V1 release. The story they told to users was important, but they told it in a way that was confusing and unhelpful to most users. So, I created a means of users browsing this various data through the VOD Tool, which now supercharged it by directly correlating a user’s stream - minute by minute - to what was happening with their audience, subscriptions, chat, etc!

Accessibility Studies
Our last goal was to make the tool more accessible. Twitch had extremely limited data visualization solutions, and none of which passed accessibility guidelines. I set out to create a custom color pallet and control schema that would remedy this. These changes set a precedent for vast improvements within the design system that defines the Twitch experience.

V2 Experiment & Release
To test our hypotheses for this product, we released the v2 to 50% of all creators (about 400k total users) over one month. In that timeframe, the V2 had some incredible results beyond what the V1 had already achieved:
On average, the V2 was utilized (via CTR) 3x the amount of the V1, with monetized creators using it even more:
Affiliates used the product at a rate of 3.5x more than V1
Partners used the product at a rate of 6x more than the V1
Users showed preference for various default metrics, routinely selecting them on entry.
Minutes watched, Chatters, Followers all saw statistically significant increases in selection
Due to the success of the experiment, VOD Tool’s V2 was officially released to all creators in March of 2023.